
01
Train performance
Speed-distance-time profiles using tractive effort, braking, mass, resistance, gradients, curves and speed restrictions.
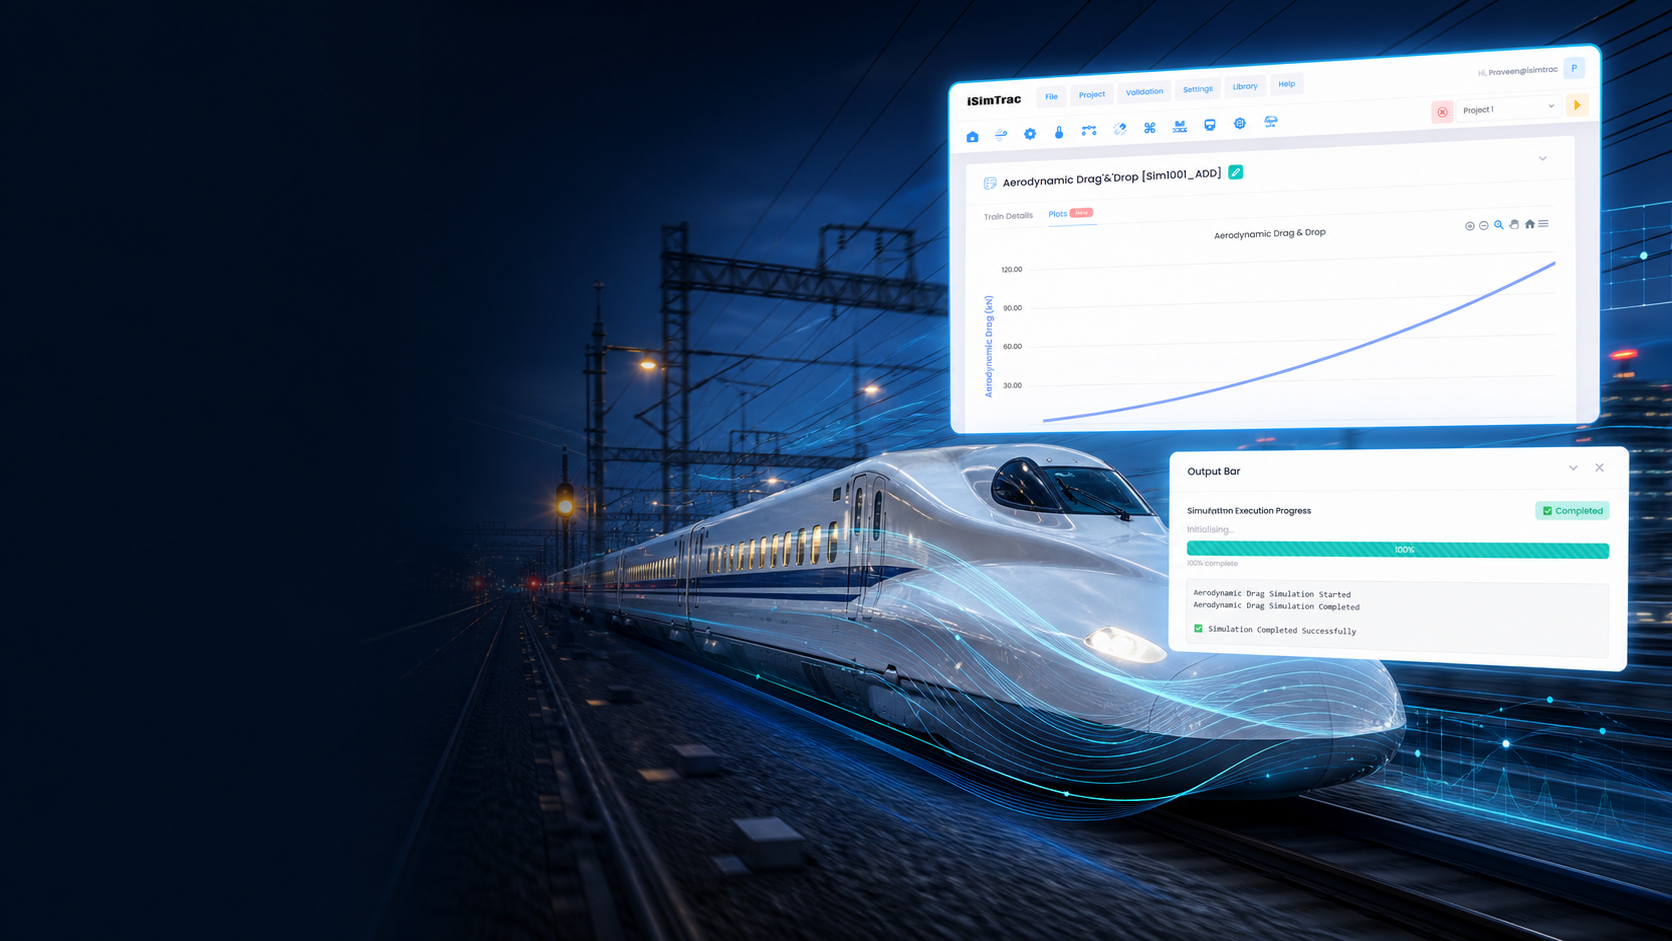
Test the railway in a digital model before changing the real one.
Panacean combines rolling-stock performance, route geometry, timetable logic and traction-power infrastructure to study journey time, headway, capacity, voltage and energy. Scenario comparison makes infrastructure and operating trade-offs visible before investment.
Each workstream is configured around the decisions, users and systems that will consume the result.
Speed-distance-time profiles using tractive effort, braking, mass, resistance, gradients, curves and speed restrictions.
Headways, dwell times, conflicts, turnbacks, perturbations and service-pattern feasibility.
AC or DC network representation, substations, feeding sections, voltage profile, loading and peak-demand analysis.
Traction consumption, regenerative braking, receptivity, losses and energy impacts of driving or timetable strategies.
New stations, line extensions, substations, rolling stock, service frequency and degraded operating conditions.
Time-distance diagrams, speed profiles, voltage and loading plots, energy balances and scenario dashboards.
Our process makes assumptions visible, validates the model against available evidence and translates analysis into an implementable workflow or decision.